
Data flows in automatically, from every feature
Task completion, SLA status, beat adherence, attendance, compliance scores, and expense data feed the same system, with no manual entry.
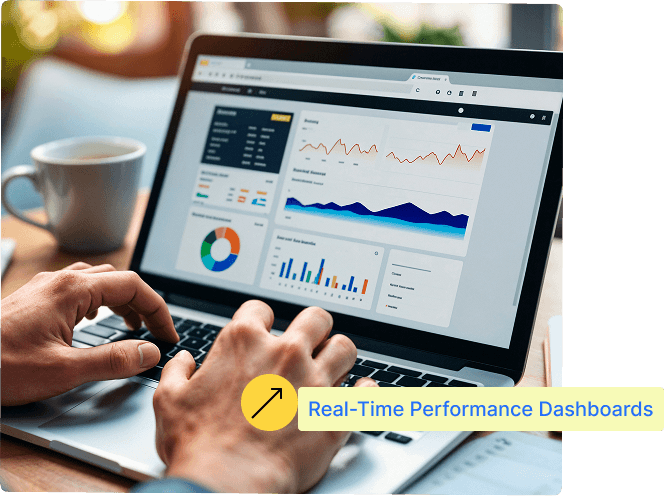
Every task, visit, SLA, and expense already lives inside Geo Task Manager. Sekel's Performance Analytics turns that data into role-based dashboards, from a company-wide view for leadership down to a single rep's task list, updated live instead of compiled once a month.
The problem
Performance data lives scattered across spreadsheets, WhatsApp updates, and separate systems, none of it talking to the other. By the time someone compiles a monthly report, the numbers are already old and the quarter is already lost. Worse, raw activity gets mistaken for productivity, a manager can't easily tell who is actually driving results from who is simply busy.
How it works
The same underlying data powers every dashboard, at whatever level of detail the role needs.
Task completion, SLA status, beat adherence, attendance, compliance scores, and expense data feed the same system, with no manual entry.
Leadership, department heads, regional managers, and field reps each get a dashboard built for their level, not a one-size view.
See completion rate, turnaround time, and SLA compliance across the team, updated as tasks move rather than at month-end.
Individual and team performance rolls up into a scorecard, making it clear who is driving results, not just who is busy.
See who is overloaded and who has spare capacity across the field team, before it shows up as missed deadlines.
Move from a company-wide number down to the specific tasks or visits behind it, in the same view, without switching tools.
Build and save the exact view a team needs, with the metrics and filters that matter to them, without waiting on a developer.
Set a report to go out daily, weekly, or monthly to the right recipients, with no one needing to remember to send it.
Forecast where performance is trending, and flag risk to a target early enough to actually do something about it.
Leadership Team
Sees company-wide performance against goal in one view, with predictive alerts before a target is actually missed.
Department Head
Tracks their department's numbers directly, without waiting for a compiled report to know how the month is going.
Regional Manager
Compares territory performance side by side, spotting which region needs attention before it drags the quarter down.
Sales Manager
Sees team scorecards and workload distribution together, so coaching and reassignment decisions are based on data, not gut feel.
HR / Operations
Pulls performance data directly for reviews and reporting, without reconciling numbers from five different sources.
Field Sales Officer
Sees their own completion rate and SLA record in the same app they work from, with no separate report to request.