
Every module feeds one analytics layer
Sales orders, inventory movements, warehouse activity, deliveries, returns, and payments all flow into the same data layer no separate exports, no manual consolidation across systems.
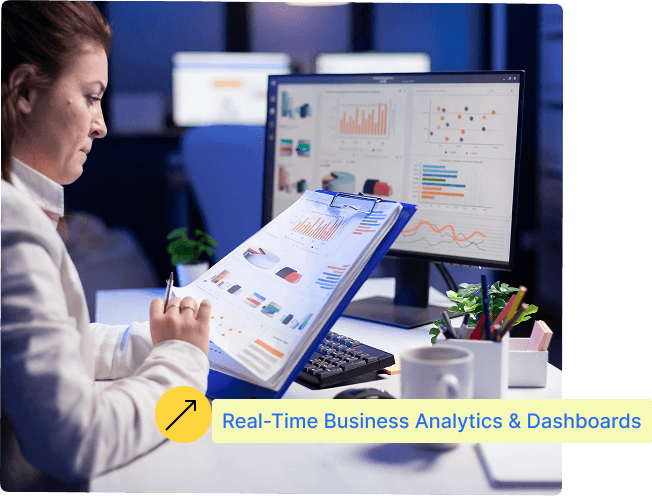
Every order, invoice, stock movement, and delivery in O2C feeds one analytics layer. Sekel's Analytics, Reporting & AI Forecasting turns that data into dashboards your teams actually use and predictions that prevent stockouts, missed collections, and slow-moving inventory before they cost you.
The Problem
Most reporting tools show yesterday's numbers, pulled from disconnected systems, reconciled by hand into a spreadsheet. By the time a stockout, a payment delay, or a slow-moving SKU shows up in a report, the cost has already been incurred the report is a record, not a warning.
How it Works
Every transaction across O2C feeds the same analytics engine, which powers both real-time dashboards and forward-looking AI predictions.
Sales orders, inventory movements, warehouse activity, deliveries, returns, and payments all flow into the same data layer no separate exports, no manual consolidation across systems.
Sales, order, inventory, warehouse, distributor, and executive dashboards each built for how that role actually works.
AI models predict demand and sales patterns per SKU and per location, based on real, ongoing transaction data.
Reorder points and quantities proposed automatically, reducing both stockouts and excess inventory across the network.
AI recommendations for routing orders to the optimal warehouse or fulfilment point, based on stock, location, and load.
Unusual order, payment, or claims patterns are flagged automatically for review catching issues before they escalate.
Fulfilment rate, delivery performance, and order-to-conversion tracking by location, by partner, by time period.
Revenue trends, return rates by product and reason, and payment collection efficiency all in the same connected view.
A consolidated, network-wide view for leadership combining performance, forecasts, and flagged risks in one place.
Brand Leadership
Uses the executive dashboard to see network-wide performance, forecasts, and flagged risks in a single consolidated view.
Sales Team
Tracks order volume, conversion, and territory performance in real time, without waiting on a monthly report.
Supply Chain / Operations
Acts on AI replenishment recommendations to prevent stockouts and reduce excess inventory across every location.
Finance Team
Monitors revenue, collection efficiency, and payment anomalies flagged by AI, without manually cross-checking reports.
Warehouse Manager
Compares productivity and accuracy against other warehouses using the same real-time performance dashboard.
Distributor
Views their own performance dashboard - sales, fulfilment, and payment status - without requesting reports from the brand.